These results came from a consumer AI tool with active category demand and weak long-tail competition. B2B SaaS engagements operate in narrower markets with longer consideration cycles. Expect 60 to 90 days before similar inflection patterns appear, and expect smaller absolute numbers because B2B audiences are smaller. Industry, baseline visibility, product-market fit, and competitive density all change the curve. The methodology produces movement; the magnitude depends on factors outside any operator's control. Past performance is not a guarantee of future results.
When this engagement started in early April 2026, the AI image generation tool had limited organic visibility. The site was indexed but ranking nowhere meaningful, and traffic was almost entirely direct or referral. Thirty days later, it ranks for terms across its category, pulls 2,400+ search clicks for the month, and is appearing in the kind of long-tail queries the methodology was built to capture.
This page documents what happened, what was done to cause it, and how to read the numbers honestly. The data is real, the methodology is documented, and the limits of the claim are stated openly above.
The starting state Where this began
For the three months prior to engagement (late January through early April 2026), the tool's Google Search Console performance was a flat line. Sub-20 daily clicks, occasional spikes from one-off Reddit traffic, and otherwise minimal organic visibility. Average position floated around 40 to 50 across a small set of indexed pages. Most queries were branded or near-branded.
The product itself was solid; the problem was discoverability. Buyers in the category were researching tools through community forums, comparison threads, and AI-engine queries, and the tool was invisible in those answers. The 3-month flat baseline shows up clearly in the GSC chart further down, where the inflection coinciding with engagement start makes the attribution unambiguous.
What I did The methodology applied, in 30 days
The same four phases that run on every Zilwaris client engagement, compressed into a 30-day cycle:
- Capture. Mapped the questions the tool's users were already asking AI engines and search engines. Pulled 30+ candidate queries from Reddit threads, Quora answers, and competitor SERPs. Scored and selected the 20 with the highest movement potential.
- Investigate. Ran each query across ChatGPT, Perplexity, and Google to map citation sources. Documented where competitors appeared, where the tool didn't, and where the citation surfaces were weak (i.e. recoverable).
- Target. Built a 4-week content sequence prioritizing surfaces with the highest citation weight per category: long-tail blog content for Google, Reddit comment placements where competitors were already cited, and answer-shaped content engineered for AI extraction.
- Engineer. Each piece was written for citation, not engagement. Answer-first openings, named-entity density, schema markup, and consistent author attribution. Published on a regular cadence over 4 weeks.
Results The 30-day curve
The intervention point in the data is unambiguous. For 60+ days before engagement, the GSC line is flat, hovering at 5 to 20 daily clicks. From early April when the methodology started running, clicks rise from sub-20 daily to over 100 daily within two weeks. Impressions follow on the same trajectory. By the end of the month, the site is pulling 2,400 monthly clicks and 20,500 monthly impressions.

Industry-average organic CTR is around 3%. An 11.8% CTR at average position 32.4 means the content ranks lower than peak but pulls a disproportionate share of the impressions it earns. That's the citation-engineered content doing its job: when it surfaces, it gets clicked.
Engagement What happened after the click
The traffic produced compounded engagement. The 30-day engagement period shows what the methodology actually drove on the site itself:
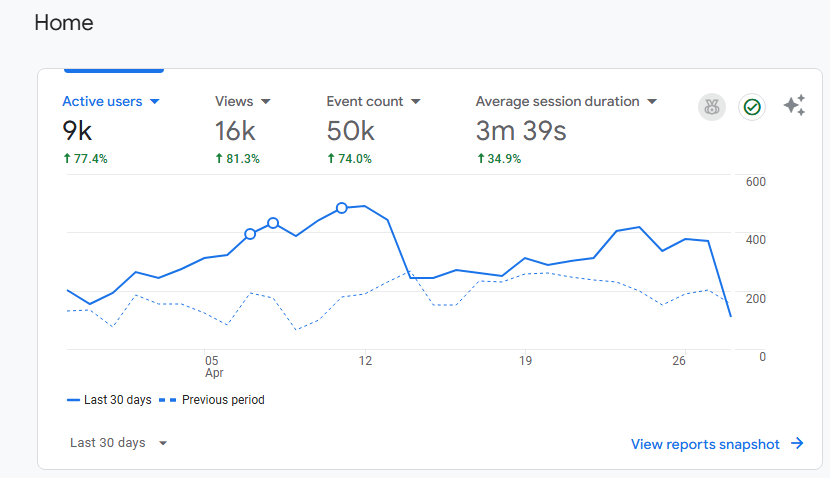
Active users up 77%. Views up 81%. Event count up 74%. Average session duration up 35%. These are the kinds of numbers that don't happen by accident or seasonal drift. They happen when an audience the tool wasn't reaching before starts arriving and engaging with the product.
Channel mix Where the traffic came from
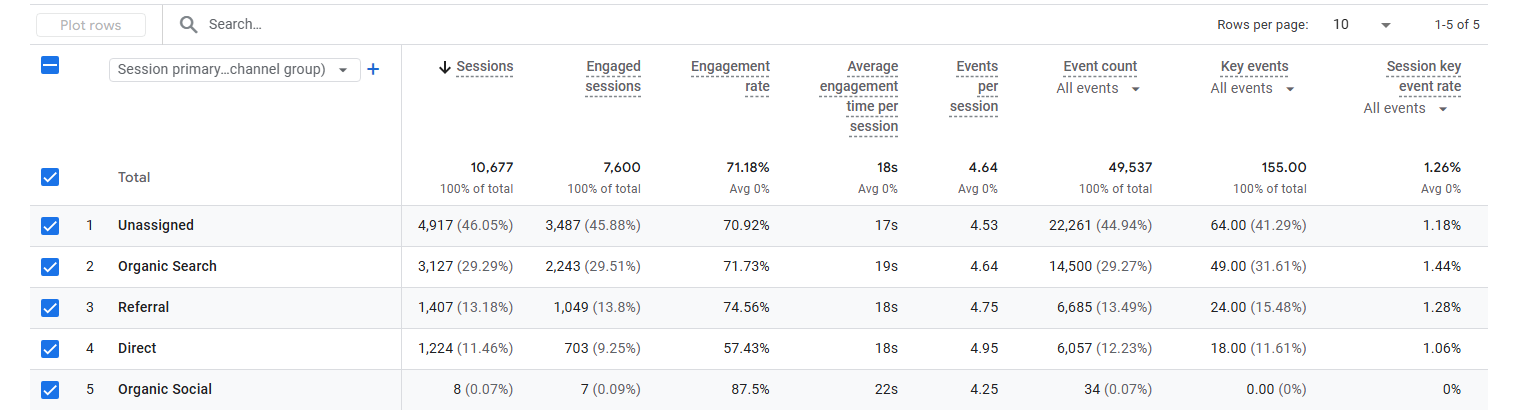
Organic Search jumped to 29% of traffic, with 71.7% engagement rate, not a vanity metric here, since these visitors came from queries the methodology specifically targeted. Referral traffic at 13% reflects the surface-seeding work. The "unassigned" 46% is a mix of dark social, AI engine referrals, and bookmark direct entries that GA4 can't fully categorize.
The most important number ChatGPT is the third-largest source of traffic
This is the single most direct piece of evidence that the methodology is working as designed. When you drill from channel-level data down to specific source/medium attribution, ChatGPT shows up as a source in its own right.

1,245 users arrived directly from ChatGPT in 30 days, with a 65.6% engagement rate. That isn't accidental traffic. Users were getting recommendations from ChatGPT and clicking through to the site. The methodology's whole purpose is to make this happen. Here it's measurable. The top referrer overall (aiagentstore.ai) is also AI-adjacent, suggesting the surface-seeding work placed the tool in directories and aggregators that AI engines then cite.
The "not set" row at #4 (1,025 users) is also worth understanding. Some of that is direct traffic without a referrer; a meaningful portion is likely Claude, Perplexity, and Google AI Overviews referrals where the engine doesn't pass a standard referrer header. Combined with the explicit chatgpt.com row, the realistic share of AI-search-driven traffic is likely 20 to 25% of total, higher than what channel-level reporting alone would show.
If the goal of the methodology is to be the answer AI engines give, this is what success looks like at the data level: the AI engine itself becomes a top traffic source.
What this proves And what it doesn't
What this proves: the methodology produces measurable visibility movement when run on a 30-day cycle. Indexation, citation, and click-through patterns improve in the trajectory the framework predicts. The flat-then-inflection curve, with the inflection coinciding exactly with engagement start, is the methodology's signature working as designed.
What this doesn't prove: that consumer AI tooling traffic dynamics translate directly to B2B SaaS. They don't. B2B SaaS has narrower buyer pools, longer consideration cycles, and different citation surfaces. A B2B SaaS engagement will produce the same shape of curve, but the timing and absolute numbers will differ. Expect 60 to 90 days to inflection rather than 30, and expect total impressions and clicks to be smaller because the addressable audience is smaller. The first true B2B SaaS case study is the next one to publish. That work is in progress with Zilwaris's first founding clients.
Lessons What I'd take into the next engagement
- The intervention point is the proof. Pre-engagement baseline data matters more than peak numbers. A flat line followed by an inflection coinciding with engagement start is the only way to attribute results to the work rather than to coincidence. Documenting the baseline before starting is non-negotiable for every future engagement.
- CTR is the early signal. Before clicks scale, CTR climbs. If the right content is being placed, even pre-inflection impressions pull above-average click rates. Watching CTR independently from clicks is the leading indicator I trust most.
- The "unassigned" channel matters and is hard to measure. Almost half of recent traffic isn't categorically attributable. Some of it is AI search, some is dark social, some is direct from bookmarks. Better tooling for AI referral attribution is needed industry-wide.
- Schema and named-entity density are the real moats. The content that pulled the highest CTR was the most operationally specific: named tools, named comparisons, schema-marked FAQs. Generic explainers underperformed even when they ranked.
- Industry context is everything. A consumer AI tool with active demand and weak long-tail competition produced a 30-day inflection. A B2B SaaS in a competitive niche with mature category authority will not produce the same curve in the same window. Setting that expectation before signing is mandatory.